

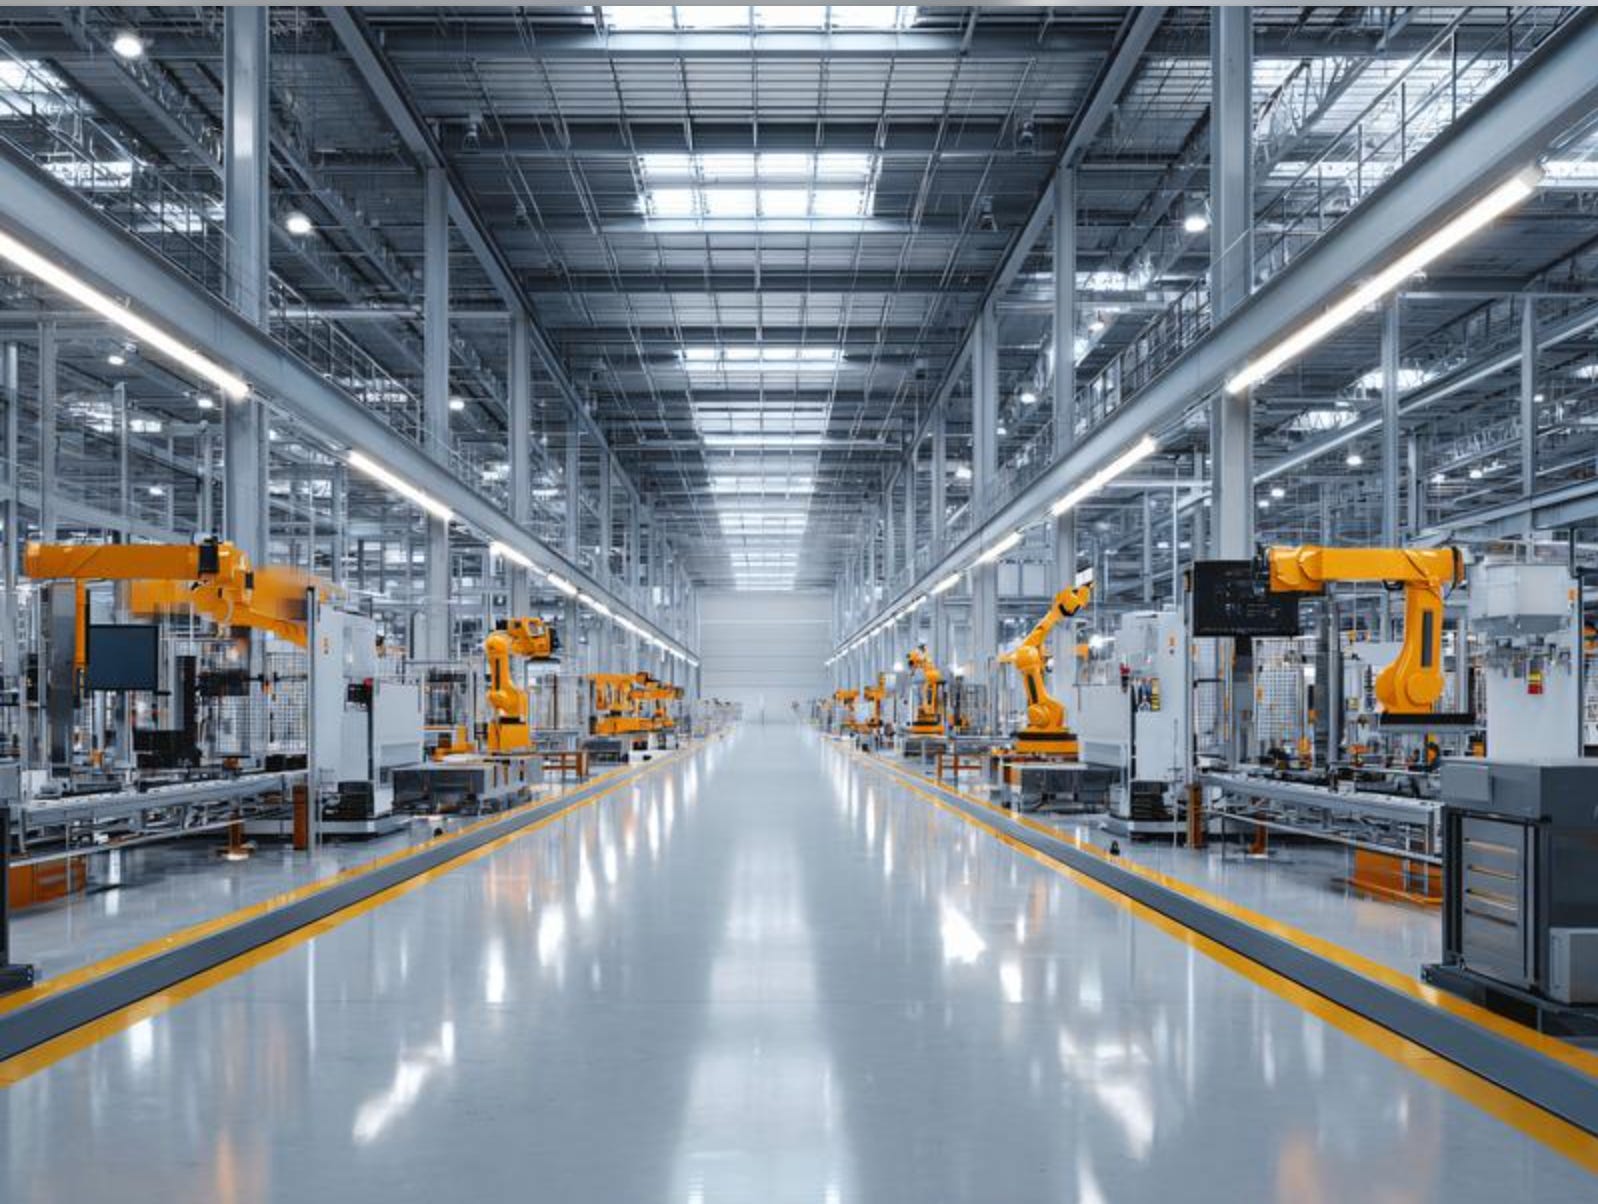
In December 2021, Toyota announced a $1.29 billion battery plant in North Carolina. By 2025, the commitment had grown to nearly $14 billion, production had begun, and more capacity was planned through 2030.
Factories are long bets. Toyota’s Kentucky plant has been running since 1988. Its Long Beach operation has passed the half-century mark. The North Carolina plant could still be producing batteries in 2050. Perhaps well beyond.
Toyota is headquartered in Japan, one of the oldest societies on earth. Its new plant sits in the United States, where population aging is projected to be more gradual. Demographics alone don’t explain the decision. Markets, costs, technology, trade policy, and supply chains all matter.
But the contrast raises a question every manufacturer and investor should ask: What will the population look like when today’s factories reach their prime production years?
Same Direction, Different Speeds
Demographic change is usually told as one story. Populations are aging. Birth rates are falling. Workforces are shrinking.
True. But incomplete. The speed of change varies enormously. So does where each country begins.
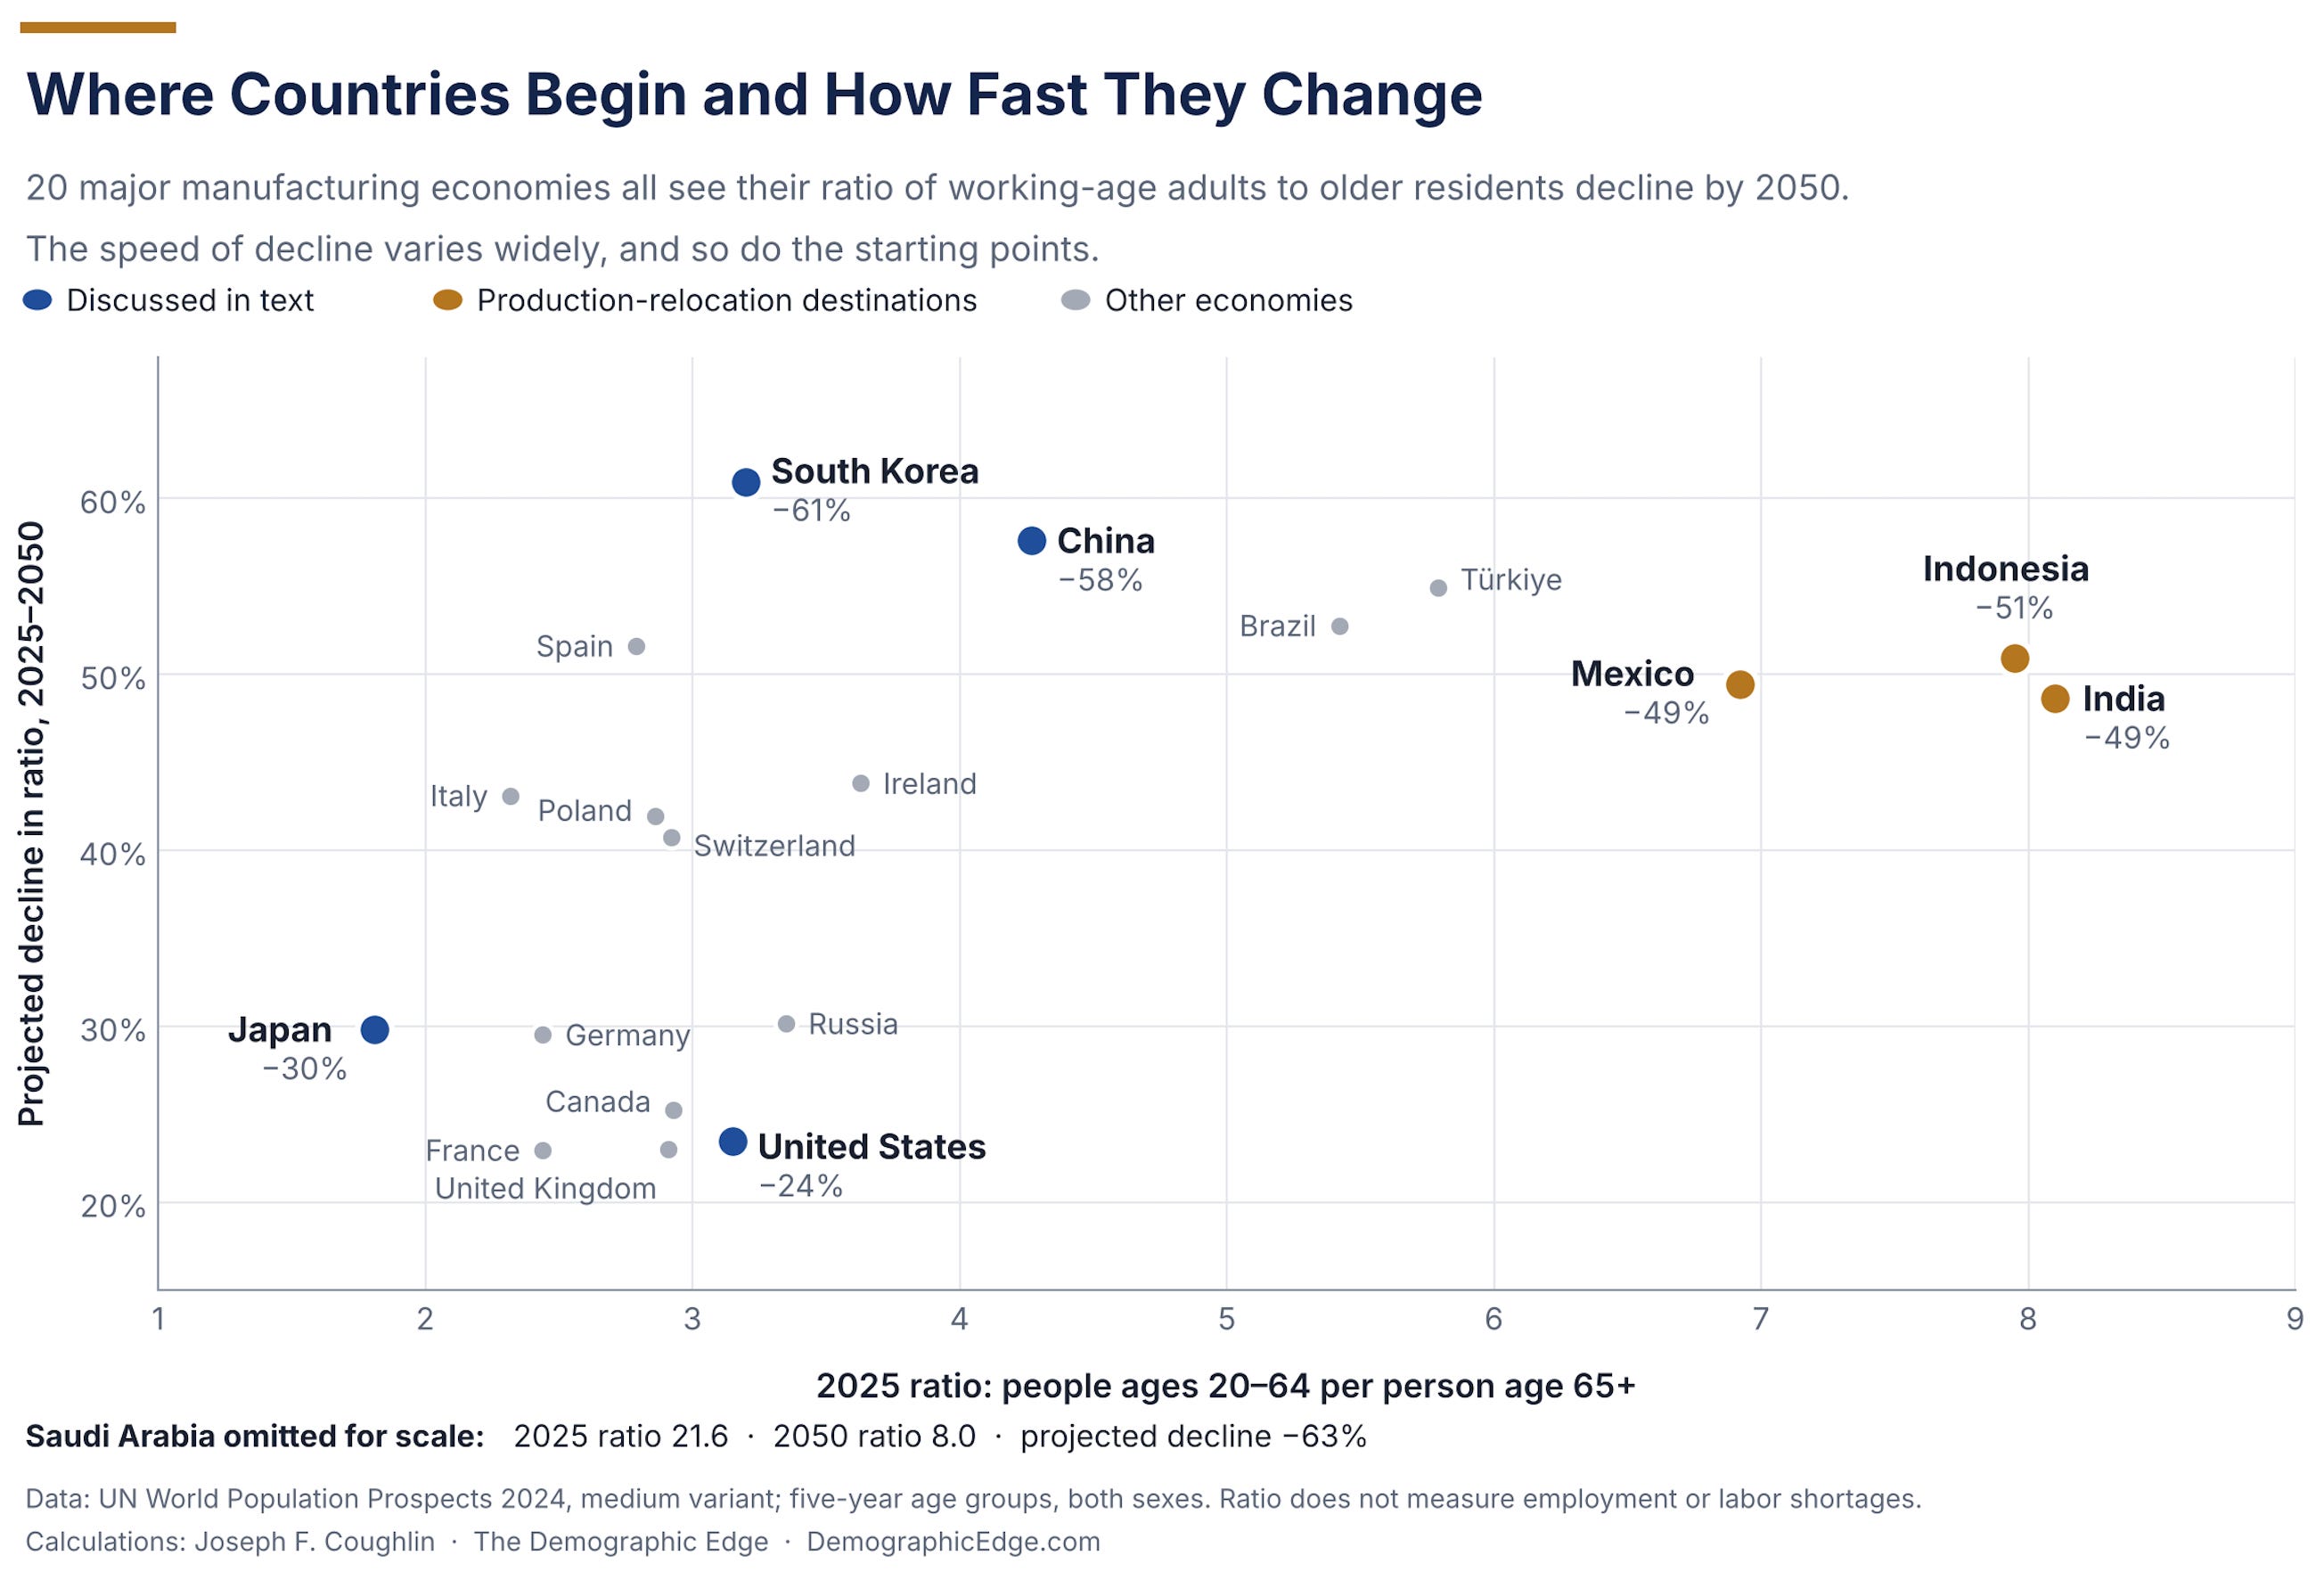
Using the UN’s World Population Prospects 2024, I compared 20 major manufacturing economies from 2025 to 2050 on a simple measure: people ages 20–64 for every person 65 or older. It isn’t a forecast of labor shortages. It describes the demographic ground a labor market stands on, and how fast that ground is shifting.
All 20 ratios decline. Not equally.
South Korea falls from about 3.2 working-age adults per older resident to 1.3, a drop of nearly 61%. China goes from 4.3 to 1.8, nearly 58%. The United States slides from 3.2 to 2.4, about 24%. That gentler American slope partly reflects assumptions about continued immigration. Demographic projections, it turns out, can depend on political decisions.
Now look at starting points. Japan is already at 1.8, heading to 1.3. A decline of about 30%, comparatively gentle. Yet Japan already struggles to staff its factories, hospitals, and construction sites.
Saudi Arabia presents almost the opposite picture. It starts at roughly 21.6, reflecting a much younger population that includes a large foreign workforce, and falls to 8.0 by 2050. A 63% drop. Even then, it will have far more working-age adults per older resident than Japan has today.
A country can be old and changing slowly. Another can be young and changing fast. For a company committing billions to a facility that will run for decades, both the starting point and the speed matter.
Moving Factories, Not the Clock
For a decade, companies have been rethinking where they make things. Rising costs in China, geopolitical tensions, tariffs, and fragile supply chains have pushed manufacturers to consider India, Mexico, and Indonesia.
The catch: all three, though younger than many established manufacturing economies, fall in the faster-changing half of the 20.
India has about 8.1 working-age adults per older resident, against China’s 4.3. By 2050, India’s ratio is projected at about 4.2, roughly where China stands today. India’s working-age population is still projected to grow, so a falling ratio doesn’t mean fewer potential workers. It does mean the ground will shift under any factory built there today.
Relocating a factory can reduce geopolitical risk. It doesn’t relocate you out of demographic change.
Automation helps. South Korea, Japan, and Germany, all facing demographic pressures, have long been leaders in industrial robotics. Add artificial intelligence (yes, I had to get AI in here), and the labor math shifts again.
But robots don’t install themselves. Factories need engineers, technicians, electricians, and skilled tradespeople. So do the new hospitals, healthcare facilities, and senior housing developments being built down the road. An aging society doesn’t just put pressure on the supply of workers. It creates new demand for the very ones factories need.
And the timelines don’t match. A plant takes years to build. A skilled workforce can take longer to develop.
Time Is Demographic Capital
Demographic projections can’t tell a CEO where to build the next factory. They can reveal what conventional investment analysis may miss: how much the population beneath today’s assumptions will change over the life of the asset.
Every long-lived investment carries an implicit demographic bet. Boards scrutinize the cost of capital and the tariff schedule. But how often do they stress-test the population a plant will depend on in 2045?
Demographics offer something unusual in long-range planning: a substantial degree of visibility. Most of the people who will work, retire, and need care in 2050 have already been born.
The advantage won’t necessarily go to whoever has the youngest workforce today. It may go to those who make the best use of demographic time: matching automation to changing labor conditions, building skills pipelines years ahead of need, and weighing a site’s future as carefully as its current costs.
Toyota’s North Carolina plant could still be running when today’s kindergartners are old enough to work there. They’re already born. They’re already counted.
The question is whether anyone in the boardroom counted them.
Note on Data: United Nations, World Population Prospects 2024, medium variant. Ratios are people ages 20–64 per person age 65 or older. Percentage changes are calculated from unrounded population estimates and projections.